New Insight: Benchmarking Your Employee Benefits Strategy
In past posts we’ve reviewed why the Gravie model for defined contribution employee benefits makes perfect sense for various employers. We’ve also looked at how three immutable forces are happening now that makes the timing just right.
For many decision makers, it’s also helpful to hear how other organizations – those with a similar number of employees, location, and likely similar constraints and goals – are choosing to define their employee benefits budget.
With that in mind, we’ve added benchmarking detail for organizations evaluating and implementing Gravie. During your kick-off and implementation process, we’ll work with your team to apply this insight for your specific situation. Here’s what’s new:
Employee Dollar Benchmarking
This view provides you insight into what employers like you provide to employees relative to their family status (Single, Single Plus One, and Families). It also highlights which plan “metal” levels are purchased by Gravie members within your peer group.
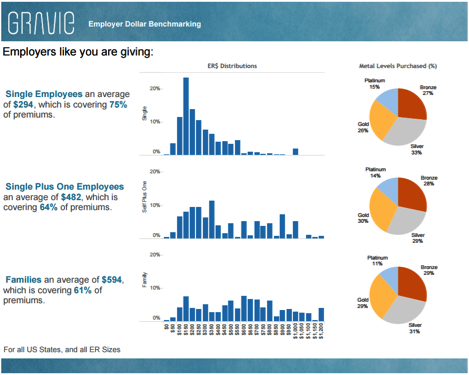
This Employee Dollar Benchmarking view helps answer the questions “how much do other organizations like mine contribute and how far does that money go for employees?”. This in turn helps you cater your benefits strategy to your goals, such as attracting and retaining key talent, controlling costs, or eliminating the hassle of administration. Using this data, you set contribution levels and maintain a predictable, set budget. Gravie account managers also work with you to set and refine your strategy to make sure you’re compliant and prepared as your organization grows.
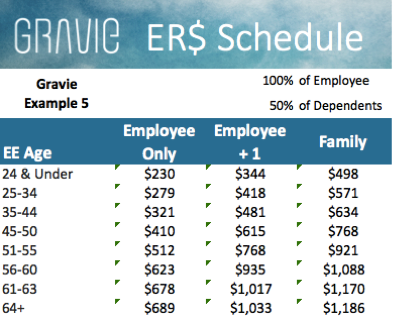
Age-Band Cost distribution Benchmarking
The second category of benchmarking breaks down a schedule of costs by age band. The sample view below shows dollar contributions by age tier benchmarked to a Gravie example plan. This view shows contribution amounts on a percentage basis, which in this example shows the contribution levels needed for an employer to cover the equivalent of 100% of employee costs and 50% of dependents costs. The view draws on real plan data and is dynamic, so employers can adjust to match their own best fit.
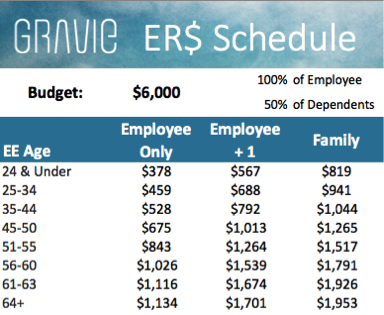
Similarly, the view below shows how to allocate a fixed budget of dollars equitably among employees, so employees of different ages and family situations get the same amount of purchasing power. This is a powerful way to re-think not just the dollar amount of plans, but takes into account differing plan costs for differing ages. In this view, the employer sets a budget ($6,000 per month in this example) and the dynamic worksheet distributes that budget equitably for all age groups. So if your workforce includes diverse ages, you can use these views to make sure nobody gets left out in the cold.
Using these unique tools and our experience with hundreds of other employers of nearly all shapes and sizes, we’ll work with you to show you how your data and costs play out. In other words, we’ll help you determine the defined contribution approach that matches your organization’s goals.
Ready to find out if Gravie is a fit for your organization? Contact us today or get started with a Dynamic Financial Analysis to set your defined contribution strategy.